As more and more businesses adopt microservices and leverage cloud infrastructures, keeping track of services and resources becomes increasingly important. Comprehensive monitoring is needed to ensure optimal performance, avoid downtime and ensure all have a great user experience. But leaving monitoring to the cloud provider may not give you the insights you need.
This post explores options for Amazon Web Services (AWS) monitoring, the range of tools you can use and the best practices available to help your business effectively monitor resources and achieve optimal performance.
AWS monitoring refers to tracking and analyzing the performance and health of the different resources and services hosted on the AWS cloud. AWS resources can include EC2 instances, databases, storage systems, networking services and more.
The goal of monitoring is to ensure that these resources are functioning optimally and to quickly identify and fix issues that may impact the performance or availability of applications running on the cloud platform.
Monitoring involves the collection of metrics such as CPU utilization, network traffic and disk usage. You can then set alarms to notify you when performance metrics exceed predefined thresholds. This way, you can quickly identify and fix issues that may impact the performance of your AWS resources.
AWS monitoring can also involve tracing requests made to applications running on AWS. By tracing requests and identifying bottlenecks, you can optimize applications for better performance and reduce the risk of downtime.
Now let’s look at what AWS uses for monitoring. Below is a list of six tools that monitor AWS resources.

Netreo is a full-stack monitoring and observability tool that collects and analyzes metrics data from various AWS resources. These resources include EC2 instances, S3 buckets, RDS instances, API gateways, Lambda and ELB functions. Netreo uses AWS CloudWatch APIs to collect metrics data and then correlates and analyzes the data to provide insights into the health and performance of AWS resources. The monitoring solution uses a range of metrics, including CPU utilization, memory usage and network traffic.
In addition to real-time monitoring, Netreo also provides a historical analysis of metrics data, allowing IT teams to identify trends and patterns in the performance of their AWS resources. Historical data helps IT teams predict future performance issues and proactively prevent downtime and performance degradation.
Netreo’s key features include:

Retrace provides monitoring capabilities for applications running on AWS infrastructure by using traces and logs. Collecting trace data and log information from various sources, including AWS CloudWatch logs, Windows event logs and Linux syslog, Retrace consolidates this data into a centralized view.
Retrace monitors the health and performance of applications by analyzing trace data, which provides a detailed record of each transaction that occurs within an application. The full lifecycle APM solution uses this information to identify bottlenecks, errors and other issues that could impact the performance and availability of the application.
Key features include:

Amazon CloudWatch is a monitoring and observability service provided by AWS that collects and processes log and metric data from various AWS services and resources. CloudWatch’s primary function is monitoring the performance and health of AWS resources and applications in real time.
AWS CloudWatch collects logs and metrics from various AWS resources, such as EC2 instances, RDS instances, ELB and Lambda functions. It then stores the collected data for further analysis and processing.
Key features of CloudWatch include:

A distributed tracing service, AWS X-Ray helps you analyze and debug distributed applications in the cloud. It allows you to understand how requests and responses flow through their applications, plus identifies performance issues and errors you might otherwise find difficult to diagnose.
AWS X-Ray captures and records data from every request that passes through the application. This data includes metadata, such as the service name, operation name, time stamp and information about the request and response payloads. The tool then visualizes this data as a trace map, showing how requests and responses flow through the application and highlighting potential errors or bottlenecks.
Key features include:

AWS Config is a service that provides automated monitoring and governance of AWS resources. You can use AWS Config to assess, audit and evaluate the configuration of AWS resources, ensuring you comply with company policies, industry regulations and best practices.
AWS Config continuously monitors the configuration of AWS resources, such as EC2 instances, security groups and S3 buckets, and captures configuration details such as the resource type, attributes, relationships and metadata. The service then tracks changes to these resources over time, allowing users to assess policy compliance, detect drift from desired configurations and troubleshoot issues.
Key features include:
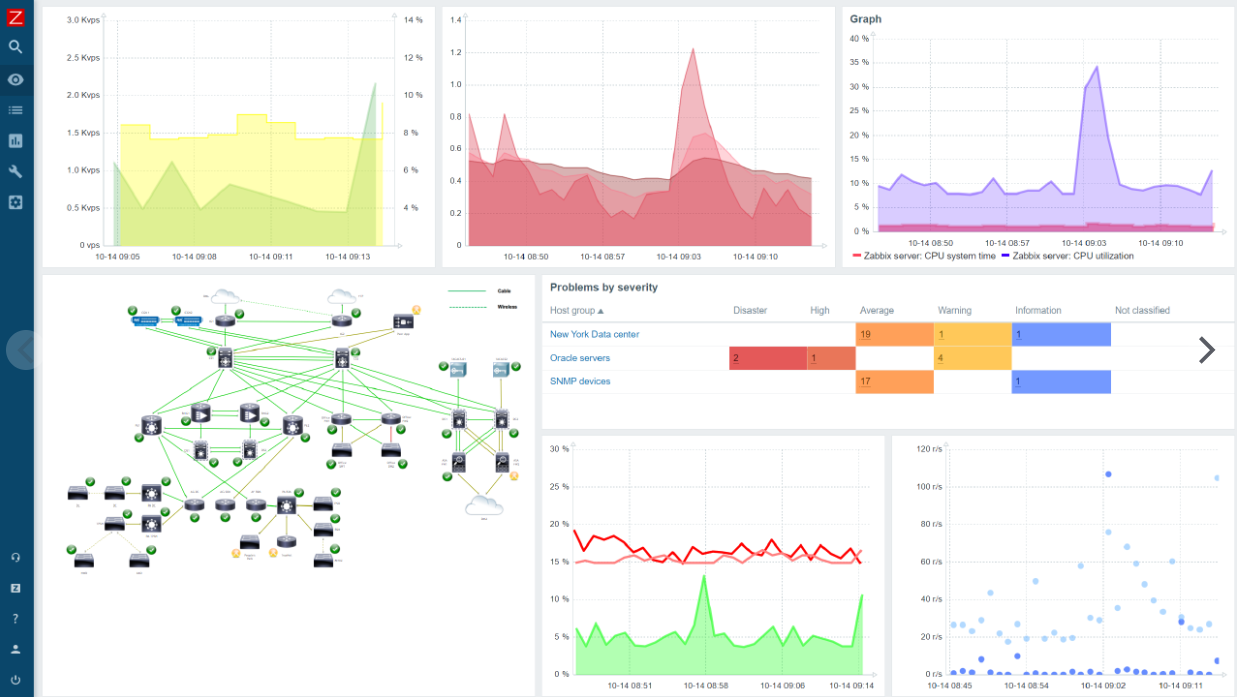
Zabbix is an open-source solution that monitors and sends alerts about IT infrastructure components, including servers, networks, applications and services. Using a centralized monitoring server to collect data from agents installed on monitored systems, Zabbix allows users to visualize and analyze the health and performance of their entire IT environment from a single dashboard.
Zabbix works by deploying lightweight agents on the systems to be monitored, collecting metrics such as CPU usage, memory utilization, network traffic and application performance data. It then sends the data back to the central monitoring server for analysis and visualization.
Zabbix’s key features include:
Below are some best practices for AWS monitoring:
AWS monitoring is critical for ensuring optimal performance and avoiding downtime in the cloud. Monitoring tools can help you monitor the performance of your AWS resources. Follow best practices to ensure your AWS resources are running smoothly and to avoid costly downtime.
To get closer to true observability, use a combination of AWS native tools, Netreo and Retrace.
This post was written by Mercy Kibet. Mercy is a full-stack developer with a knack for learning and writing about new and intriguing tech stacks.