Missing performance data or statistics on dashboards or reports is always troublesome and could be critical. Let’s say you and your IT team recently added a new server to handle your growing graphics department. First thing in the morning, you hop on your IT operations dashboard to check CPU Utilization. Yikes! No performance data. You check your recent server report and find nothing there, either.
For customers with the DIY spirit and know-how, Netreo Customer Support takes a look at troubleshooting missing performance data in our continuing How To series.
Like virtually every troubleshooting task, start by testing connectivity to the device in question. In this case, we’re looking at the server supporting our growing graphics team.
A number of steps require a sample device, so have a sample device with a known IP address handy for reference. Knowing how the device was added to Netreo is very helpful, too, since similar devices are typically added the same way. You’ll also need to know whether the device is associated with a Service Engine. So, before you begin …
As we’ve seen in several How To posts, Testing Connectivity is commonly among the first actions you should take. Netreo captures performance data and stats for individuals and groups of devices. In this scenario – whether your new graphics server belongs to a group or not – test connectivity to the device from your Netreo instance.
To test connectivity, use the Credential and Connectivity Test tool. Navigate to Administration -> Tools -> Credential and Connectivity Test.

By testing credentials, customer networking teams are able to identify whether the credentials applied to the device in question are functioning properly. IT teams can also determine if access methods are blocked in some way. What’s more, troubleshooting credentials is relatively easy and always recommended toward the start of troubleshooting.
Navigate to a device’s Overview page and click the gear symbol to go to the Admin page. Scrolling to the bottom of the Admin page, you will see the credential fields.
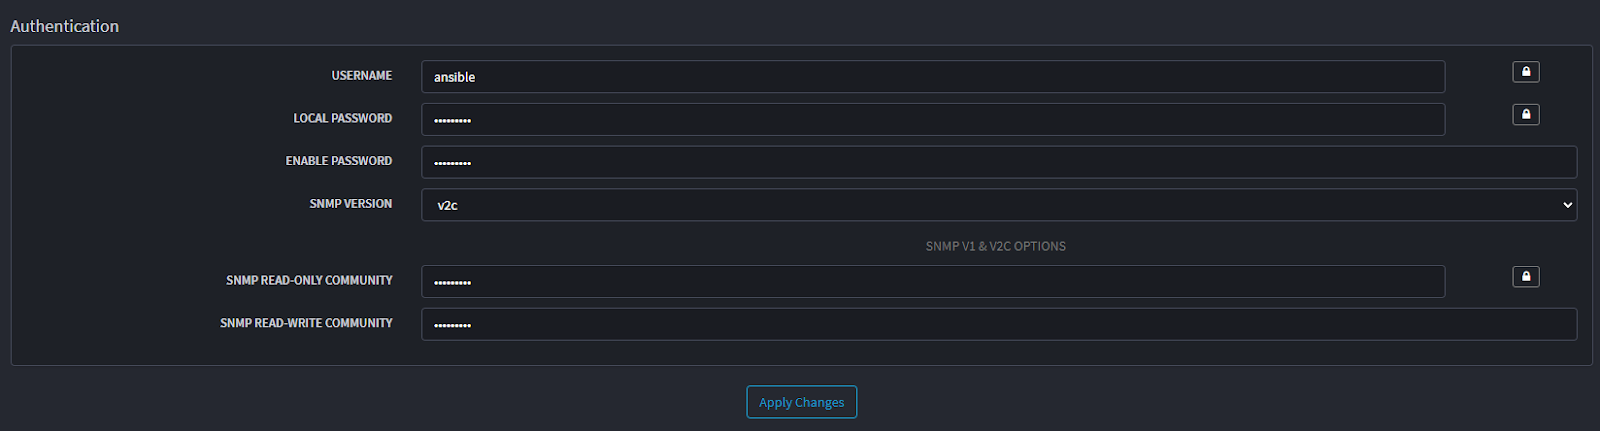
If a field has a lock symbol, then the field has credentials applied from a template. To confirm template identity, simply hover your cursor over the field. It’s a good idea to hover over each field to double check that all are correct.
Fields may also have credentials filled in that are not locked from a device template. Two things to keep in mind at this step:
To authenticate the device in question, go to Administration -> Tools -> Arbitrary Credentials Test. From here, try and make a connection to SNMP/SSH/Windows Powershell to an endpoint. The Arbitrary Credentials Tool gives a more specific response than the Test SNMP or Test WMI option. SNMP and WMI devices will respond with the Name of the device if it was successful. SSH devices will respond by attempting to run an echo “hello world” command.
In the tool, provide the IP address of the sample device and fill in the credentials manually or select a template to use. You can also use a specific Service Engine if there is one that is expected to have access.

If IT personnel get an authentication failure, you’ll need to test the local password.
If IT operations determines that the credentials configured are correct using the above steps, validate the correct “Device Type” configuration for the sample device.
At the device type page, check whether the Device Type in question matches the known device under investigation.
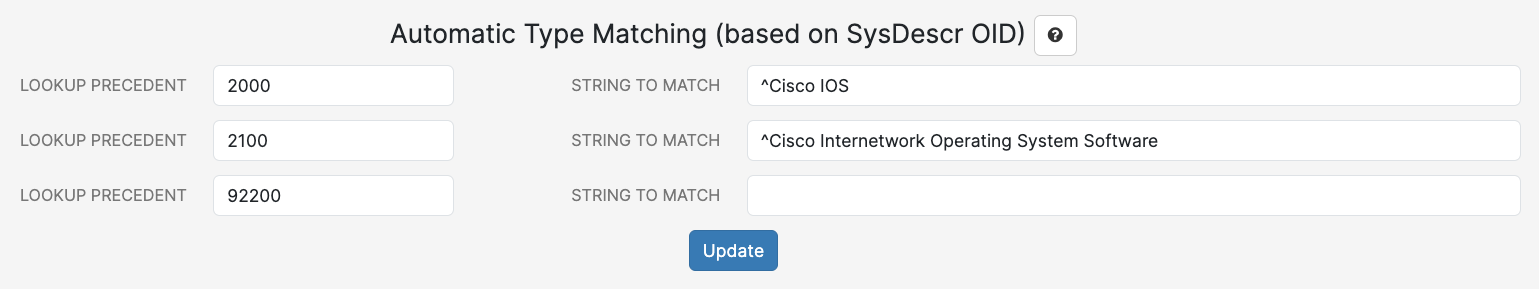
During Device discovery, SNMP devices are queried with a system description OID. Netreo uses the result of this description to assign the device type using values called “String to Match” in device types.
For example, if Cisco Router is added to the environment and the system description matches any model number in the above screenshot, then the Cisco Router device type will be assigned.
Windows Devices that respond successfully with working credentials in templates to WMI/WinRM will automatically get set to the “Windows Servers – Detailed” device type.
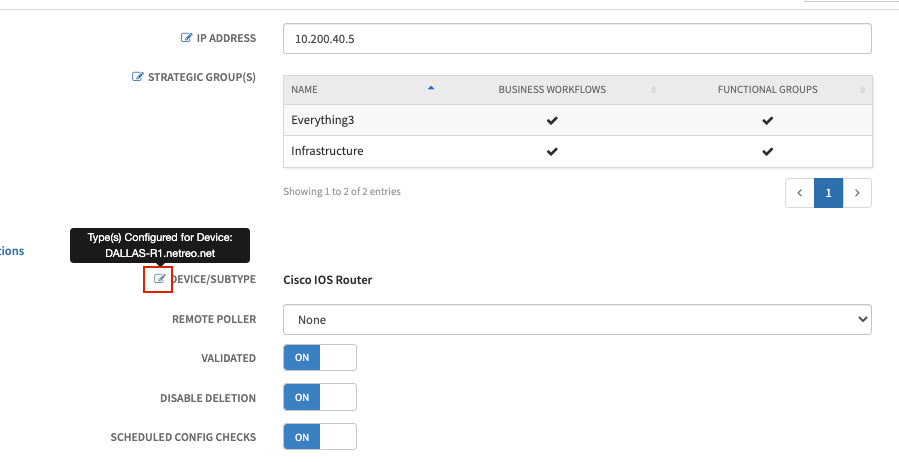
If a device fails to automatically get assigned to the correct device type, the type can be assigned manually after device discovery by navigating to the device administration page and clicking on the Device/Subtype option.
Statistics for the majority of devices are collected either through the SNMP protocol or by WMI/WinRM for Windows servers. Below we cover the steps when troubleshooting issues with Data Collection on SNMP Device Types ONLY.
In general terms, SNMP is the protocol that allows querying devices and asking for information. This information resides within a “mib” made of addresses: OIDs that point to specific information.
Netreo Device Types contain directions on what specific information is collected from a device and what OID or address we point to for that information.
Use a sample device to see Netreo Device Type assignments. Type the devices name in the global search and click on the devices name to get to the Device Dashboard for that device:
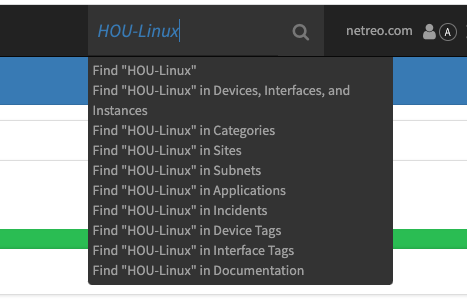
The second line in the upper left corner will show that devices Device Type

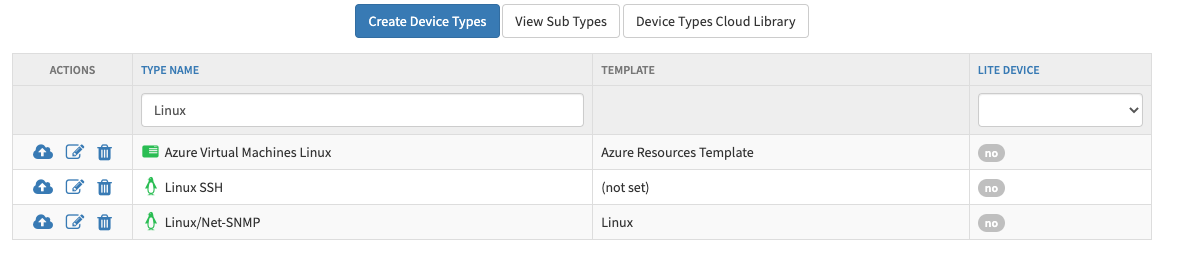
Next, go to the global Administration -> Change Devices -> Edit Device Types/Subtypes menu in the main page Header. This action takes IT administrators to a page with a list of Netreo Device Types. In the box directly under “TYPE NAME” put in the Netreo Device Type in question – your graphics server – and hit enter. This action filters the list to show only the device type or types IT administrators need:
Next, hitting the edit icon takes you to the admin page for that device type. The admin page displays the different statistics collected from the device (called Pollers), and pollers include the OIDs in use.
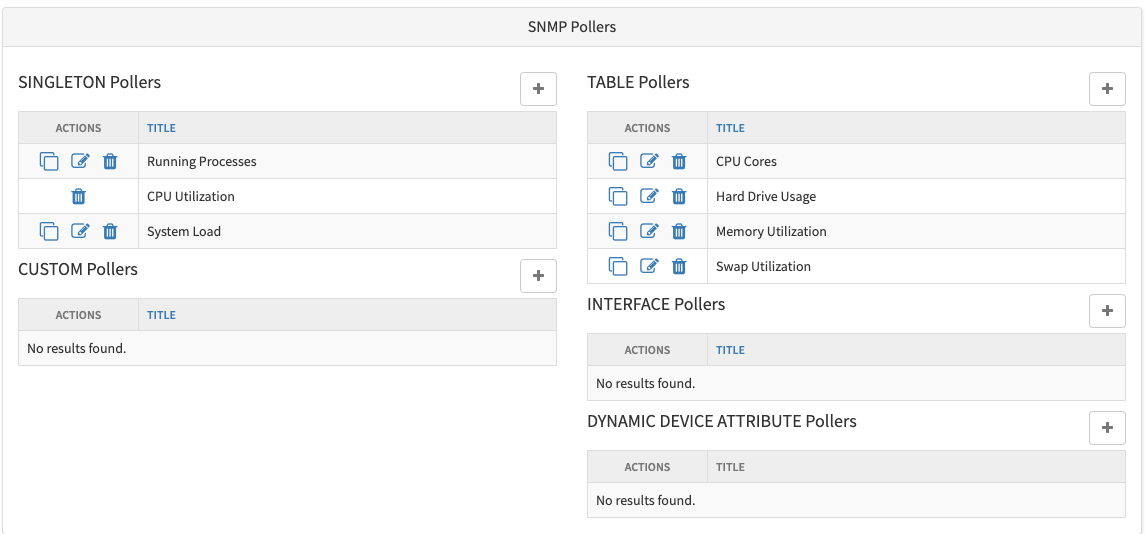
While on this page, also make note of the String to Match statements under the header “Automatic Type Matching.” These strings automatically assign Netreo Device Types to individual devices. Many times, when stats are not retrieved, the device was assigned an incorrect Netreo Device Type (tested in step 2 below):

Hit the edit icon next to the performance metric in question. This will show the OIDs used. In some cases this will also be a script. Whenever a script is showing in place or along with an OID, it’s time to contact Netreo support services.

With the OID in use, IT operations can test the device’s response to that OID.
Go to the sample devices Device Dashboard. Once on the Device Dashboard, click on the cog to the far right of the page. This will take you to the Administrative Dashboard for the device:

On that admin page, towards the right side of the page, find the dropdown called Debugging Tools. Hit that drop down and choose “Test SNMP.”

There are 2 important items to test using the Test SNMP Tool:
If the response does not contain text that matches that String to Match, assign a Device Type that is more suitable to the device in question – your graphics server.
A good response should look something like this:

If IT gets a good result, continue with a second test.

Test all OID’s referenced in the Poller.
When you receive valid responses, then the devices are responding correctly and the issue may lie elsewhere.
If no values appear or an error message displayed, check out the How to Troubleshoot Discovery Polling Failures. See that section in our recent How To, Troubleshooting Alarms Not Recovering.
Device associations with Service Engines are important. Start by going to the Service Engine Administration page in Administration -> System -> Service Engines. Click the “Netreo Remote Poller” or “Netreo Remote Collector” icon to discover devices polled by that Service Engine.
For Syslog, SNMP Traps and Netflow, relationships appear as another type of Service Engine role. These monitoring methods “Push” Device information, rather than “Polled,” like most other information Netreo captures. Customers define which Service Engine receives this information by adjusting the configuration of the Device to point to the IP of their related Service Engine. IT administrators see which Devices have a Collector by clicking the “Netreo Logging Collector” or “Netreo Traffic Collector” link next to the Service Engine in question.
Access general checks by going again to the Service Engine Administration page in Administration -> System -> Service Engines. If any of the Service Engines are showing a red alarm state, open it and navigate to the Services tab. The “Service Engine Status Check” Service Check may be in a Critical state. Some messages are Host alarms and will only show at the bottom of the Services tab in the Services State History section. If any recent critical alarms are present, be sure to notate the messages, in case you end up contacting customer support. Examples of this message could be the following:
Processes not found [‘nf_worker’, ‘nf_listen’, ‘nf_result’, ‘nf_cache’]
No updates received in the last 10 minutes.
Ignore the Device Polling Status Check if Critical at this stage. This check is not meaningful for a Service Engine.
If you still haven’t uncovered the source of your missing performance data, you can also refer the the How To mentioned earlier – Troubleshooting Alarms Not Recovering – and review the System Diagnostics section.
If all of the appropriate widgets are normal in your System Diagnostics, move onto checking your Audit and Debug Logs.
Netreo captures any action taken by any user for your review in the Audit Log. This comes in handy in many situations. Below are some sample scenarios and examples of the information in the logs that apply to troubleshooting alarms not recovering.
To access the Audit Logs, go to Administration -> System -> Audit Log.

Another good example is using the Audit Log to investigate any changes in templates that may have prevented devices from polling correctly (ex. Changes in template credentials).
Enter the template name in the message field and configure the timeframe around the time a change may have occurred.

In the above example, we confirm that user ‘netreo’ changed settings in the Cisco Firewall Template. Seeing the username netreo all in lower case indicates an automated process ran. Any other username will identify a user that has access to the system and made a change.
If you see that a template recently applied by a user other than netreo, refer to the Testing Credentials section in our recent How To post, Troubleshooting Configuration Backup Issues for further information.
By following these steps, you should uncover the cause behind your missing performance data. However, never hesitate to contact Netreo Support Services whenever you have challenges or at any step of your own troubleshooting efforts. We design Netreo smart and secure IT infrastructure monitoring solutions to make your life easier. And that’s why we include support services with every Netreo instance.
For those pondering a switch, check out details on how the Netreo Platform delivers maximum value as your network management solution. Better still, Request a Demo Today!