Observability is a powerful concept that can help you gain insight into the performance of your systems and applications. It refers to the ability to measure, monitor, analyze and manage different aspects of an infrastructure or application – from hardware components to application code.
With observability techniques such as distributed tracing, monitoring metrics, log analysis and anomaly detection, organizations can ensure their applications run smoothly without downtime or disruption. This blog post will explore observability and provide examples of its practical uses.

Observability is the practice of understanding the state, performance and behavior of systems, services, applications and infrastructure. With observability, engineers can better understand the inner workings of their systems, identify issues quickly and take corrective action before users are impacted.
Observability encompasses various techniques such as distributed tracing, monitoring metrics, log analysis and anomaly detection. These techniques provide visibility into the various components of an application or system so that engineers can identify any potential problems and rectify promptly.
For an application or system to be considered observable, it needs to have specific characteristics that enable engineers to monitor its state easily. A few key characteristics are:
Observability tools can also improve team collaboration by providing a single source of truth for all stakeholders. These tools offer intuitive dashboards that enable teams to easily share insights and keep everyone on the same page regarding monitoring system performance. As a result, teams can address any problems that arise in real time more effectively. The increased visibility and shared knowledge give organizations the ability to make more informed decisions about where to allocate resources for maximum efficiency.
Monitoring typically involves regularly measuring specific parameters to detect system behavior abnormalities. Observability provides real-time visibility into all aspects of an infrastructure or application, from hardware components to application code, enabling quick problem identification and resolution.
Let’s take a look at three pillars of observability.
Logs are an essential component of observability. Developers can use logs to track events, identify errors and analyze trends over time. When collecting log data for observability purposes, organizations must consider the type of data they collect, the sampling frequency and the storage and analysis methods they use.
Metrics are another core component of observability that enable engineers to track key performance indicators over time. By capturing request latency, throughput and other performance metrics with granular detail, IT teams are better equipped for effective troubleshooting.
Traces provide engineers with detailed visibility into transactions within an application or system so that engineers can diagnose and fix errors quickly. Trace data helps developers understand how different application components interact and identify blockages or bottlenecks in real time.
Let’s explore a few examples of observability and how it can help organizations detect and resolve issues faster, reduce downtime and improve overall system performance.
Observability can be a powerful tool for debugging distributed systems. With detailed data from logs and traces, engineers can pinpoint the exact source of an issue, diagnose and fix it in a timely manner. In particular, traces enable developers to see the entire transaction process from start to finish to quickly identify issues, such as errors in API calls or requests taking too long to complete.
In addition to tracking key performance indicators, metrics enable teams to track trends over time to measure the impact of changes or improvements to their infrastructure or application. In addition, metrics provide valuable insights into how different components of an application interact with each other so that teams can identify and resolve bottlenecks.
Observability tools have totally changed how companies monitor and analyze their systems. But with so many types of observability tools available, how do you choose the right one for your organization? In this section, we’ll explore the different kinds of observability tools and their use cases to help you make an informed decision.
Tools that offer true observability provide comprehensive visibility into system performance and behavior over time. They typically collect data from multiple sources, including logs, metrics and traces, to give engineers deep insights into their applications, systems and infrastructure. These tools also employ advanced analytics capabilities to identify potential issues quickly. Popular tools that offer true observability include Netreo, Datadog and others.
Tools that claim to offer observability but in truth provide infrastructure monitoring don’t provide the same level of visibility or insights into application or system performance as those that offer true observability. These tools only track basic metrics such as CPU or memory usage, and are limited in their ability to identify complex problems within a system. Additionally, these tools often lack the sophisticated analytics capabilities necessary for quick problem detection and resolution.
To be clear, infrastructure monitoring is still important and helpful. We’re not suggesting you should stop monitoring your infrastructure! But true observability tools will do more for you and make your products more resilient.
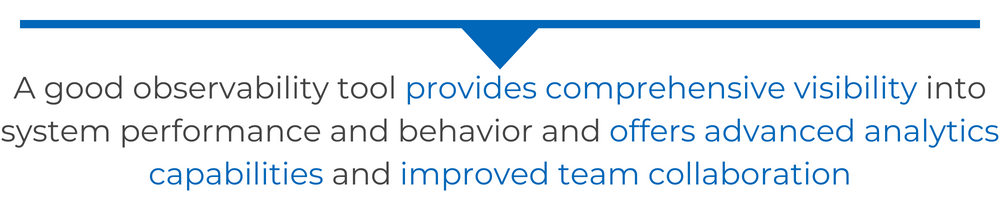
The importance of choosing the right observability tool cannot be overemphasized. A good observability tool provides comprehensive visibility into system performance and behavior, offers advanced analytics capabilities and improved team collaboration. A powerful observability tool enables organizations to make data-driven decisions quickly and accurately and meet compliance requirements and industry standards.
Additionally, observability tools allow engineers to track their systems over time to ensure they are meeting critical performance goals. This is especially important for companies that require compliance with certain regulations such as PCI DSS or HIPAA.
Overall, having a robust observability tool such as the Netreo ITIM solution or Retrace by Netreo provides superior visibility into system performance and behavior. Increased visibility allows organizations to make more informed decisions about their infrastructure, comply with industry regulations, improve operational efficiency and effectively monitor their application’s time.
Observability tools provide comprehensive visibility into system performance and behavior over time. By leveraging advanced analytics capabilities within the tool, organizations can ensure they always comply with security requirements.
Robust observability tools help teams make better decisions about resource allocation and adhere to industry standards for improved operational efficiency. Whether you’re looking to meet compliance or simply want insight into your application’s performance and behavior, observability tools like Netreo can help you achieve your goals.
This post was written by Keshav Malik, a highly skilled and enthusiastic Security Engineer. Keshav has a passion for automation, hacking and exploring different tools and technologies. Dedicated to staying ahead of the curve, Keshav constantly seeks new opportunities to grow and improve as a professional.